Want to understand the basics of Google Analytics but don’t have the time for training? As part of a new ‘Beginners Guide’ blog series, we’re going to take a look at how to measure the activity and traffic coming from your website using Google Analytics. You’ll learn why you need it, how to set up goals and how to navigate your way around reports.
Why do I need Google Analytics?
If you operate a blog or website, Google Analytics can provide a complete and concise analysis of real-time data. Initially, beginners should prioritise looking at the demographic of the people that visit the website, the most popular pages and searches, which marketing techniques drive the most traffic and the typical journey that visitors take.
There is so much more information that Google Analytics can provide but these are just a few of the most important areas that can help beginners get started.
How to set up your Google Analytics account
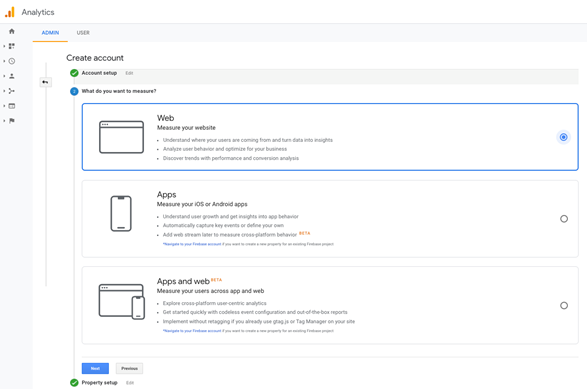
First, you’ll need to register for a Google account and create a Gmail email address or associate an existing email address to a new Google account. Once you have this first stage set up, you can go to Google Analytics and sign up. Fill out the information required about your website name and URL etc. You’ll also need to specify what you want to measure from three options: Web, Apps or Apps and web. For a beginner, who is looking to measure a website and understand user behaviour to optimise their business performance, the ideal option is Web. This should look something like the image below.
The next stage allows you to install your tracking code which is a snippet of code that follows and collects the activity of a website user. This must be installed on every page on your website to allow Google Analytics to gauge accurate data. The installation process varies based on the platform you use, the plugins and the domain of your website. Instructions on how to install the tracking code on any website can be found by doing a simple web search.
Navigating Google Analytics Reports
Google Analytics can be a haven of data. While you won’t need every report available, you should explore all that they have to offer.
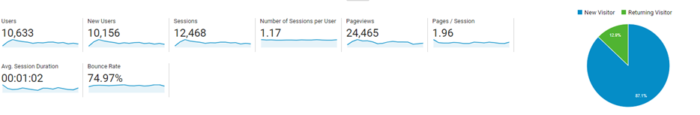
Once you start learning about your website traffic, it’s useful to compare and explore this data in the Audience Overview report. This is the first of over 50 reports that are available which analyse in-depth information gathered from your website user. The main metrics provided are compiled into graphs and expandable tabs that take a further, more detailed look. For example, you can look at the statistics in the location tab by hovering over different areas on the map to display specific figures and information about visitors in that location.
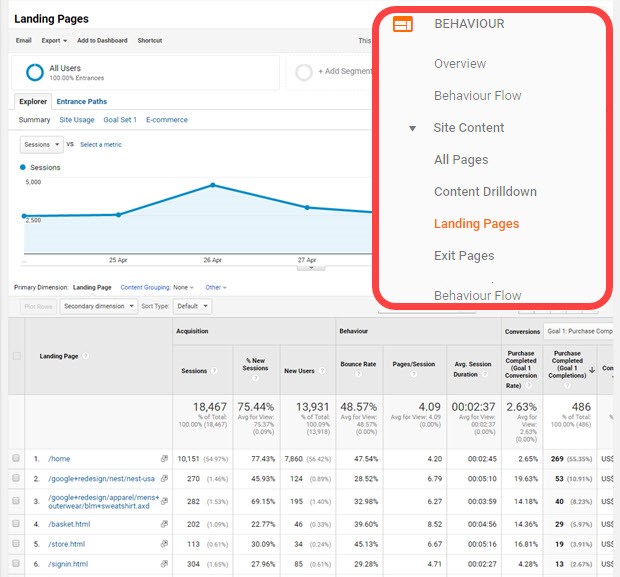
The Behaviour Flow report also allows you to see what the most popular pages are, understand what areas of content your audience likes and engages with the most, whilst also helping to identify any problem areas.
A crucial figure to focus on here is the bounce rate. Google’s definition of bounce rate is the percentage of single pageview visits to a website. It represents the number of visitors who enter the site and immediately leave rather than continuing to view other pages within the same site. As a rule of thumb, a bounce rate in the range of 20% to 40% is excellent. 41% to 55% is roughly average. 56% to 70% is higher than average but may not be cause for alarm depending on the type of website. Anything over 70% could be a warning sign that the website isn’t performing well so it’s important to analyse your analytics, address where any problems lie and work to improve those relevant areas. For example, the All Pages report will delve deeper into the bounce rate for each individual page on your website. If you are able to identify that customers aren’t engaging with a select few pages, this may be due to difficulties operating and travelling through the site. If the customer does not have an easy path to take them to the next step, their engagement will quickly be lost.
Alternatively, the problem may also lie with ineffective marketing adverts. If your users are being taken to your website via an external link, make sure the ad is relevant to your audience and your site. This will ensure you’re engaging with the correct audience, who are more likely to explore and take a journey through the site.
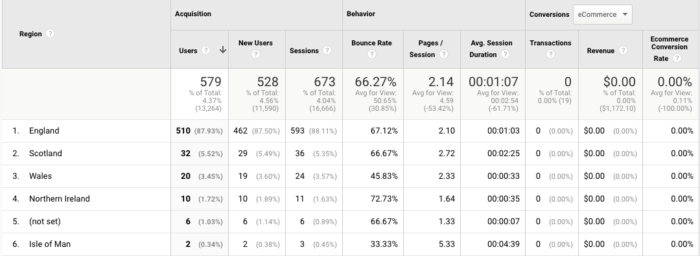
Precise information about visitors such as what drives them to the website and the path they take, can be found in the Audience reports. This will give you a full demographic report and tell you all you need to know about their age, gender, general interests, location, how often they visit and the technology they use to view your website.
How to set up Goals
Implementing Goals allows you to analyse the success of your website by tracking specific targets. For example, if your website is used as a platform to sell a product, setting up a thank you or confirmation page for visitors to land on once the purchase is complete, will generate data in Goals. The information will provide a breakdown of the customers activities and journey through your website. Up to 20 goals can be created for your website per view so be sure to priorities what is highly important and dependant to your business. Once you have created a goal, it cannot be deleted, so make sure you are happy with what you have set-up and test to see if your goal is working. Your goals may vary so some key examples could be lead form submissions, email sign-ups and purchases made.
As you get more familiar with the analytical tools in the dashboard and the sea of data available, analysing your user’s behaviour and businesses performance will become second nature.
If you found this beginners guide to Google Analytics useful, keep an eye out for part 2!